Introducing Financial Information of Seoyon E-Hwa.
- Financial Summary
- Statement of Financial Position
- Income Statement
Management Information
| Establishment | July 2, 2014 |
|---|---|
| Listing Date | August 8, 2014 |
| Capital | 135 (KRW 100M) |
| End of Settlement | 31. December |
| Total Assets | 18,038 (Consolidated Basis, Unit: KRW 100M) |
Summary Information
- Consolidated Basis, Unit: KRW 100 M
| Category | FY2018 | FY2019 | FY2020 | |
|---|---|---|---|---|
| Financial Status | Total Assets | 16,962 | 18,205 | 18,038 |
| Total Liabilities | 10,296 | 11,989 | 11,717 | |
| Total Capital | 6,666 | 6,216 | 6,321 | |
| Profit and Loss Status | Sales | 18,508 | 19,768 | 19,624 |
| Operating Profit | 120 | 219 | 485 | |
| Operating Profit Ratio | 0.6% | 1.1% | 2.5% | |
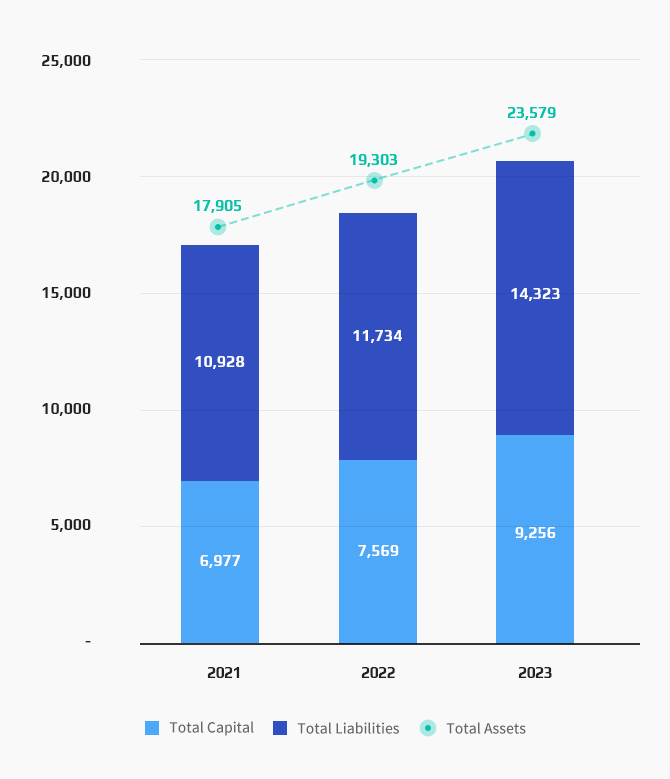
Financial Status
- Consolidated Basis, Unit: KRW 100 M
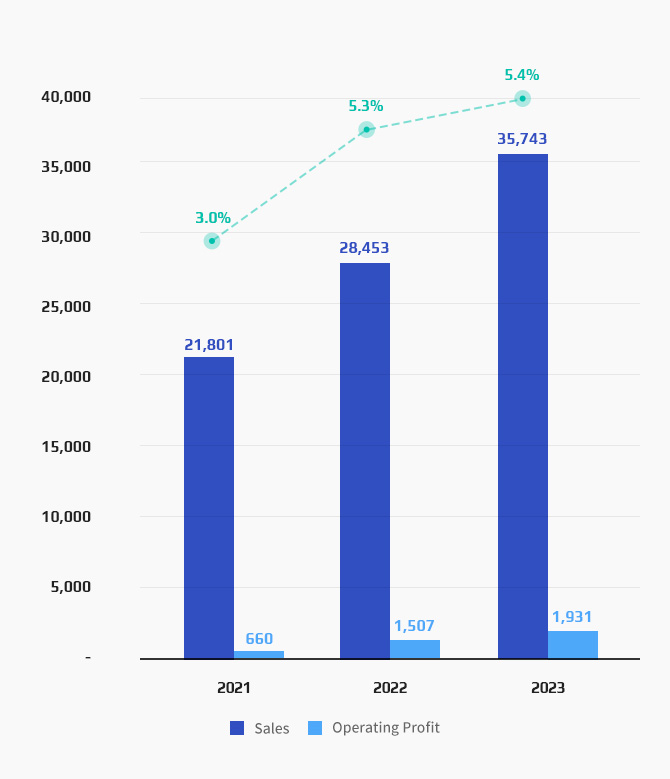
Profit and Loss Status
- Consolidated Basis, Unit: KRW 100 M
Consolidated Basis
(Unit: KRW M)
| Category | 2018 (5th Term) | 2019 (6th Term) | 2020 (7th Term) | |
|---|---|---|---|---|
| Assets | Current Assets | 853,176 | 785,736 | 807,650 |
| Non-current Assets Held for Sale | - | 4,675 | 2,004 | |
| Non-current Assets | 843,054 | 1,030,130 | 994,183 | |
| Total | 1,696,230 | 1,820,542 | 1,803,838 | |
| Liabilities | Current Liabilities | 864,896 | 943,932 | 909,499 |
| Non-current Liabilities Held for Sale | - | 18,487 | 2,548 | |
| Non-current Liabilities | 164,717 | 236,518 | 259,726 | |
| Total | 1,029,612 | 1,198,938 | 1,171,772 | |
| Capital | Capital | 13,514 | 13,514 | 13,514 |
| Capital Surplus | 416,027 | 416,027 | 445,818 | |
| Other Capital Components | (152) | (152) | (152) | |
| Accumulated Other Comprehensive Income | 2,262 | 10,190 | 11,311 | |
| Profit Surplus | 222,819 | 171,473 | 132,430 | |
| Non-controlling Interest | 12,148 | 10,552 | 29,145 | |
| Total | 666,618 | 621,604 | 632,066 | |
| Liability Ratio | 154.5% | 192.9% | 185.4% | |
- ※ Korean International Financial Reporting Standards (K-IFRS).
- ※ Please refer to business reports in “Disclosure Information – Electric Disclosure” or “Disclosure Information – Announcements.
Separate Basis
(Unit: KRW M)
| Category | 2018 (5th Term) | 2019 (6th Term) | 2020 (7th Term) | |
|---|---|---|---|---|
| Assets | Current Assets | 355,126 | 395,377 | 406,201 |
| Non-current Assets | 736,820 | 730,972 | 702,939 | |
| Total | 1,091,946 | 1,126,350 | 1,109,140 | |
| Liabilities | Current Liabilities | 390,508 | 439,055 | 410,730 |
| Non-current Liabilities | 40,853 | 78,490 | 96,445 | |
| Total | 431,362 | 517,546 | 507,175 | |
| Capital | Capital | 13,514 | 13,514 | 13,514 |
| Capital Surplus | 462,539 | 462,539 | 462,539 | |
| Other Capital Components | (152) | (152) | (152) | |
| Accumulated Other Comprehensive Income | (1,784) | 16,222 | 17,386 | |
| Profit Surplus | 186,467 | 116,680 | 108,676 | |
| Total | 660,584 | 608,804 | 601,964 | |
| Liability Ratio | 65.3% | 85.0% | 84.2% | |
- ※ Korean International Financial Reporting Standards (K-IFRS)
- ※ Please refer to business reports in “Disclosure Information – Electric Disclosure” or “Disclosure Information – Announcements.”
Consolidated Basis
(Unit: KRW M)
| Category | 2018 (5th Term) | 2019 (6th Term) | 2020 (7th Term) |
|---|---|---|---|
| Sales | 1,850,754 | 1,976,766 | 1,962,384 |
| Cost of Sales | 1,678,394 | 1,767,959 | 1,722,876 |
| Gross Profit | 172,360 | 208,807 | 239,508 |
| Sales and Administrative Expenses | 160,334 | 186,930 | 191,043 |
| Operating Profit (Loss) | 12,026 | 21,876 | 48,464 |
| Non-operating Income | 85,662 | 51,674 | 39,874 |
| Non-operating Expenses | 78,105 | 112,763 | 118,761 |
| Net Profit (Loss) before Corporate Tax | 19,583 | (39,212) | (30,422) |
| Corporate Tax Expenses | 24,985 | 5,426 | 10,410 |
| Net Profit (Loss) During the Term | (8,091) | (48,334) | (40,833) |
| Operating Profit Ratio | 0.6% | 1.1% | 2.5% |
- ※ Korean International Financial Reporting Standards (K-IFRS)
- ※ Please refer to business reports in “Disclosure Information – Electric Disclosure” or “Disclosure Information – Announcements.”
Separate Basis
(Unit: KRW M)
| Category | 2018 (5th Term) | 2019 (6th Term) | 2020 (7th Term) |
|---|---|---|---|
| Sales | 936,607 | 964,614 | 1,024,103 |
| Cost of Sales | 866,553 | 867,717 | 901,787 |
| Gross Profit | 70,053 | 96,896 | 122,315 |
| Sales and Administrative Expenses | 66,211 | 72,891 | 80,813 |
| Operating Profit (Loss) | 3,841 | 24,005 | 41,502 |
| Non-operating Income | 53,885 | 39,443 | 58,331 |
| Non-operating Expenses | 48,987 | 118,245 | 110,314 |
| Net Profit (Loss) before Corporate Tax | 8,740 | (54,797) | (480) |
| Corporate Tax Expenses | 16,857 | 10,014 | 9,651 |
| Net Profit (Loss) During the Term | (8,117) | (64,811) | (10,132) |
| Operating Profit Ratio | 0.4% | 2.5% | 4.1% |
- ※ Korean International Financial Reporting Standards (K-IFRS)
- ※ Please refer to business reports in “Disclosure Information – Electric Disclosure” or “Disclosure Information – Announcements.”