Environment,
Safety, and
Health Management
- Environment, Safety, and Health Policy
- Environmental Management
- Safety Management
- Health Management
-en-pc.jpg)
As a leader in the automotive interior parts industry, Seoyon E-Hwa strives to minimize environmental risks that occur in the entire process of design, production, and sales, including the acquisition of ISO14001.
-
Environmental Management Policy
Seoyon E-Hwa Co., Ltd. declares its environmental management policy as follows in order to actively participate in the task of responding to global climate change and establish a sustainable environmental management system through Eco-friendly management innovation
- 1.Establish core strategies to achieve carbon neutrality and continuously
manage performance to achieve the goal. - 2. Carry out resource recycling and energy reduction activities, such as developing
eco-friendly materials, introducing eco- friendly processes,
and improving process efficiency through automation. - 3.Fulfill our corporate legal and social responsibilities towards the environment
by strictly complying with domestic and
international environmental laws and agreements. - 4.All executives and employees recognize the seriousness of environmental
problems and faithfully comply with their responsibilities and obligations for
environmental improvement activities.
- 1.Establish core strategies to achieve carbon neutrality and continuously
Directions
-
Operation of Effective Prevention Facilities
Air Pollutant Management
During process operation, we strive to minimize air pollutants from the source by substituting subsidiary materials. Prevention facilities are maintained in an optimal condition through periodic inspections. Through this, we are effectively reducing pollutants to 90% or less of the legal emission limit.
-
3R(Reduce, Reuse, Recycle)
Waste Management
Seoyon E-Hwa is making efforts to purify and establish the economy by reducing waste at workplaces and promoting recycling. For waste generated at each workplace, we strive to minimize the use of resources and maximize the reuse of resources. Furthermore, we are striving for optimized recycling methods by subdividing wastes by nature and type.
-
ZERO Wastewater Plants
Water Resource Management
We are striving to reduce both water and wastewater consumption. As a result, most of it is household water and firefighting water, and the amount of wastewater generated is close to 0. Also, we regularly conduct water quality inspections in conjunction with specialized consigned companies to ensure that our employees drink clean water.
-
Hazardous Chemicals Management
Since chemical accidents can be directly related to human and material loss, we are striving to prevent accidents in advance through a thorough chemical management process. With continuous process improvement, hazardous/risky substances are substituted with eco-friendly substances, and employees are regularly trained for behavioral tips and work safety rules to prevent exposure. In addition, by periodically updating GHS-MSDS, we support employees to work safely.
Seoyon E-Hwa takes the lead in safety and health by acquiring ISO 45001 under the management philosophy of realizing customer satisfaction through creative management with respect for humanity. We will advance together with the local community and customers by strengthening preventive activities and continuously improving safety and health performance.
-
Safety and Health Management Policy
Seoyon E-Hwa Co., Ltd. declares its safety and health management policy as follows in order to prioritize securing the safety and healthy life of executives and stakeholders throughout corporate activities and to establish a sustainable safety and health management system based on a safety culture and self-regulation.
- 1.To prevent industrial accidents, a sustainable safety and health management system is
established based on self-regulation to secure sufficient human and
material resources for removing and controlling risk factors at workplaces. - 2.Establish safety and health goals, and implement detailed execution plans to achieve them.
- 3.Compliance with safety and health related laws and establish and faithfully implement internal
regulations for self-regulation. - 4.Identify potential risks through worker participation, improve them, manage them to an acceptable
level, and share them through education. - 5.All executives and employees shall faithfully comply with their responsibilities and obligations
for safety and. health activities
- 1.To prevent industrial accidents, a sustainable safety and health management system is
Safety Management Activities
-

Risks Assessment
Identify hazards and risk factors in the workplace, and establish reduction measures after estimating and determining the likelihood (frequency) and severity (intensity) of the occurrence of injuries or diseases caused by the hazards and risk factors
-

Safety Training
Conduct regular safety and health training for employees, training for safety and health personnel, and safety and health training for employees in special employment types
-

Workplace Walk-around Inspection
Conduct inspection of plant lines and hazardous factors in the workplace and partners
Directions
-
Safety and Health Training
To reinforce safety awareness, we are providing legally required safety training for our employees and business partners.
In order to raise the right safety awareness and develop safety capabilities, we provide customized training for each job and season, and support employees for their practical and effective work through safety and health training for employees, training for safety and health personnel, and safety and health training for employees in special employment types. -
Support for Partner Safety and Health Reinforcement
We provide safety and health information by providing safety consulting and training to our business partners. We conduct walk-around inspections once every two days to prevent disasters that may occur in the contracting business in advance, and find hazardous parts first to take measures to improve them. We also conduct quarterly meetings and joint inspections to raise awareness of safety and prevent accidents.
-
Firefighting Management
Establishment of Intelligent Fire Management System
With 2021 as the first year of the establishment of an intelligent manufacturing plant, Seoyon E-Hwa is promoting the intelligence of overall systems such as process, logistics, quality, and safety systems. In particular, for fire safety management, we are developing into a more advanced fire management system by adding the function of real-time monitoring of firefighting facilities in connection with communication devices and the function of sending fire alarms to mobile phones.
-
Fire Prevention Activities
Being aware of large-scale fires that have occurred recently, we have selected areas vulnerable to fire, analyzed possible causes of fires, and established/improved management plans to prevent them. In particular, since many fires occur due to electricity, we periodically check earth-leakage circuit breakers and prohibit the use of personal air conditioners, heaters, and multi-plug extension adapters. We are also making efforts to minimize damage from fires by installing automatic fire extinguishing devices in areas where electric fires are a concern.
At Seoyon E-Hwa, we take the lead in improving the work environment on a regular basis, creating a safe workplace through periodic health management and consultations and helping employees work in a healthy way.
-

Musculoskeletal Disease Management
-

Employee Health Management and Consultation
-

Work Environment Measurement and Improvement Measurement
Health Management Activities
-

Operation of Health Management Center
Response to injured persons during work and identification of individual health conditions
-

Health Examinations
Support general/comprehensive health examinations for employees and their spouses
-

Hearing Conservation Program
Conduct noise exposure assessment, engineering measures, noise hazard prevention training, and regular hearing tests
-

Musculoskeletal Disease Prevention Program
Investigate hazardous factors, improve the work environment, and implement the rehabilitation treatment program
-

Health Promotion Program
Conduct health consultations and regular management for those with symptoms and diseases based on the results of health examinations
-
Intensive Management of Brain and Cardiovascular Diseases
Intensively manage employees with high blood pressure, diabetes, hyperlipidemia, triglyceride, liver disease, and high risk of obesity
Directions
-
Employee Health Management and Consultation
To improve the lifestyle and health of our employees, we conduct health examinations, operate a Health Management Center, and conduct brain and cardiovascular disease prevention programs.
-
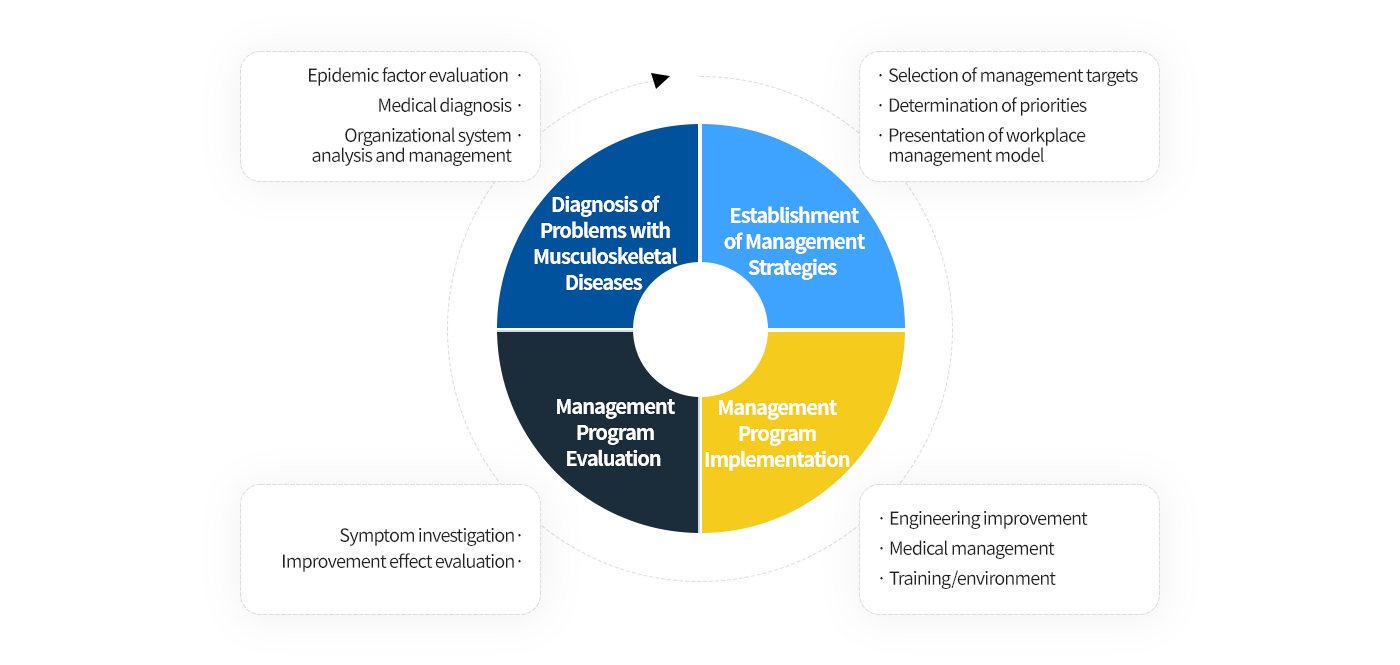
Musculoskeletal Disease Management
In order to prevent health problems caused by simple repetitive work or work that places an excessive burden on the human body, we regularly conduct a musculoskeletal risk factor survey once every three years. In addition, a rehabilitation treatment program is implemented twice a week for the injured and those who complain of pain to prevent musculoskeletal diseases.
-
Work Environment Measurement and Improvement Measurement
To protect the health of employees from hazardous factors and create a pleasant work environment, we measure and evaluate exposure to hazardous factors such as noise, dust, and hazardous chemicals through an external professional measuring institution on a regular basis once every half year. We strive to create a pleasant work environment by improving the problems found.
Musculoskeletal Disease Prevention Management Operating Procedure